
Investopedia defines equity funds as “a mutual fund that invests principally in stocks. It can be actively or passively managed”.
According to SEBI regulations, an equity mutual fund must invest at least 65% of its assets in equities and equity related instruments.
As per SEBI’s categorization there are ten different kinds of equity schemes.
These are:
- Multi cap fund
- Large cap fund
- Large & Mid cap fund
- Mid cap fund
- Small cap fund
- Dividend yield fund
- Value fund/Contra fund
- Sectoral/thematic, and
- ELSS
SEBI categorizes Index funds/ETF’s under “other schemes”.
How to analyse an equity fund factsheet?
The monthly factsheet can be downloaded from the respective AMC’s website, mostly through their download section or by googling it.
For the purposes of this article, we’ll be looking at the factsheet of a Multicap fund. This article is neither a review, nor a recommendation of the AMC/debt fund used as an example.

The section shown above, shows the following:
- Name of the fund, and
- Investment objective of the fund
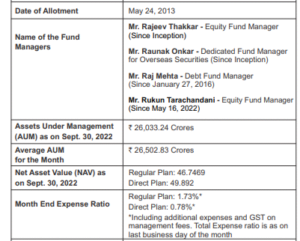
The image above provides a lot of information about the fund. The date of inception of the fund, the assets under management (AUM) of the fund, current NAV of the two different fund options as well as the latest annualised month end expense ratio which gets deducted daily from the NAV. Details regarding the fund managers are also given.

The entire portfolio of the fund is shown in the above section. The names of the companies whose securities form a part of the portfolio along with their respective industry details are mentioned. Additionally, their holdings as a percentage of the total NAV or AUM are also given in this section.
The entire portfolio is not shown in all factsheets. Some AMC’s show a part of the portfolio as “others”.
If you would like to check overlapping holdings of two different equity funds, a free tool to use is fundoo. A paid tool can also be purchased from Freefincal which allows overlapping comparison of maximum five funds at a time.
Investing in multiple equity funds which have high overlaps, does not increase portfolio diversification.
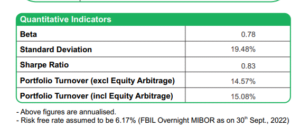
This section provides statistical data like standard deviation, Sharpe ratio, and fund beta.
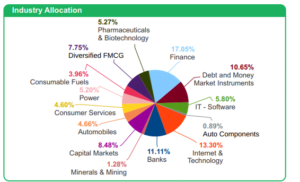
This section shows a graphical pie chart of industry wise fund allocation and the extent of portfolio diversification.
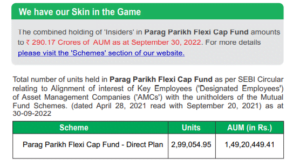
This section is a disclosure regarding the AMC employees’ holdings in this fund to show their “skin in the game”.
What are the key points while analysing an equity fund factsheet?
- All equity funds are high risk. Some funds might be relatively riskier or less risky but that does not make an equity fund “moderately” risky.
- Is the fund staying true to its investment objective? Is that objective aligned to your way of investing?
- If the fund being analysed is an active fund, you need to read the latest SPIVA report which tracks the performance or rather the underperformance of active Indian equity funds vs the index.
- What is your objective in investing in an equity fund? High returns? Beating inflation? Portfolio diversification? FOMO?
- For what period are you investing in an equity fund? Is it for a long-term goal or a short-term goal? In case it is the later, are you willing to risk part of the capital? Why?
- Do you have an asset allocation? Are you willing to stick to that allocation when the market is low or high?